Nearly 60 percent of non-financial public companies in the United States have bought their own shares since 2010. In 2015, share repurchases were US$520 billion, along with US$365 billion in dividends, adding up to US$885 billion, as compared to net income of US$847 billion. Overall distributions to shareholders (dividends plus buybacks) have fluctuated since 1985, but generally between 80 percent and 90 percent of adjusted net corporate income, leaving between 10 percent and 20 percent of profits available for investment in R&D and capital investment.
Annual total real returns of U.S. public companies (as percent) from 1940 to 1990 were about 7 percent per year. However, real returns since 1990, allowing for the share price rises due to supply reduction based on share buy-backs, is barely 5 percent per year. This has presented a challenging situation for pension funds and insurance companies, since they mostly predicated their pension and insurance offerings on a continuation of that 7 percent history.
Proponents of share buybacks argue that companies buy back stock when they have excess capital and a dearth of new investment opportunities so it’s a sensible use of cash, which can be given to shareholders who then invest it in companies that need investment. It is also argued, by some, that the long-term performance of firms that have used profits for buybacks has been shown to be superior to the performance of firms that did not do so. However, the comparison is misleading if the measure of performance is share price. While share prices of "buy-backers" may have risen, on average, the number of shares outstanding has decreased, by definition. What really counts from a macroeconomic perspective is the overall value of the firms, which has actually declined in many cases.
I would argue that shareholder value maximisation (SVM) has become a major cause of aggregate wealth depletion (growth slowdown) in the U.S. and other rich countries. In addition to draining capital that could be invested in R&D projects, SVM is also adding to corporate debt as companies borrow to fund share buybacks and it is contributing to inequality as CEO compensation is increasingly tied to per-share earnings and share prices.
Origins of a dangerous doctrine
It is important to recognize that SVM is a relatively new doctrine in economics. It is most often attributed to Milton Friedman, who wrote in New York Times Magazine in 1970: “There is one and only one social responsibility of business – to use its resources and engage in activities designed to increase its profits.”
It is pertinent to note that in 1981, the Business Round Table, an association of CEOs of big U.S. companies, said “Corporations have a responsibility, first of all. To make available to the public quality goods and services at fair prices, thereby earning a profit that attracts investment....provide jobs and build the economy.” This was noted in James Montier’s paper, “The World’s Dumbest Idea”. Yet, a decade and a half later, the idea of corporate responsibility to customers, workers or communities was out the window. The Business Round Table in 1997 pronounced that “The principal objective of a business....is to generate economic returns to its owners...if the CEO and the directors are not focused on shareholder value, it may be less likely the corporation will realise that value”. Behind those words is another assumption: share price is the best measure of shareholder value.
Capital diverted from R&D
This commitment to SVM can be seen in the performance of IBM. Compared to another corporate icon, Johnson & Johnson (J&J), it had similar total returns to shareholders after 1973. Until 1988, both firms were managed more or less according to the dicta of the 1981 Business Round Table, and they were roughly equal in terms of relative performance up to that point. The guiding principles of IBM, as recapitulated by CEO Thomas J. Watson Jr. in 1968, were respect for employees, commitment to customer service and achieving excellence in all domains of business. Shareholders were not mentioned. Similarly, the mission statement of J&J, written by its founder Robert W. Johnson in 1943, said (and still says) “We believe our first responsibility is to [all]…who use our products...We are responsible to our employees... Our final responsibility is to our stockholders...When we operate according to these principles, the stockholders should realise a fair return.”
In 1974, IBM, under the Watson regime, was the 5th most valuable company in the U.S. while J&J was not in the top 20. But, from 1990 on, IBM – run by a series of SVM advocates starting with Lou Gerstner – has lagged far behind J&J in relative terms. By 1994, thanks to short-term gains, IBM had climbed up to 4th place, after GM, Ford and Exxon-Mobil; J&J was still not in the top 20. But by 2014, J&J was 5th while IBM had fallen back to 13th place. This cannot be explained by IBM being in the wrong industry, considering that Microsoft, born, in the 1980s, as a step-child of IBM’s PC development, had reached 4th place on the list by 2014 (with Google in 3rd and Apple in 1st), according to Ross Barry.
What went wrong at IBM? Dedication to mainframe computers and failure to respond adequately to the challenge posed by DEC, Compaq, Apple and other nimbler companies in the 1980s was the first cause of its fall from grace. (Why did IBM fail to acquire Microsoft when it would have been so easy?) But since the 1990s, blind dedication to SVM (which continues) has led to unending emphasis on cost-cutting (by job cutting), lack of product innovation and the use of cash to finance corporate stock buy-backs. Between 2005 and 2014, IBM delivered US$32 billion in dividends to shareholders and spent US$125 billion buying its own shares (to prop up the share price), while investing only US$111 billion in capital investment and R&D combined. Today the corporation is a sad shadow of what it was in the 1950s, ‘60s and ‘70s. IBM could have pre-empted most of the innovations stemming from Silicon Valley. Because of SVM, it didn’t.
This story is not unique to IBM. The recent history of Hewlett-Packard (HP), the first of the great success stories in Silicon Valley, is equally depressing. When Carly Fiorina took over in 1999, she started a share buyback program. During her term (until 2005), HP bought back US$14 billion in its own stock, while earning only US$12 billion in profits. (It should have invested in Apple!) Under the next CEO Mark Hurd, HP paid US$43 billion for its own stock, while earning only US$36 billion in profits over five years. The pattern continued under Leo Apotheker (US$10 billion in stock repurchase) and Meg Whitman, who is currently in charge. By the time HP’s current “turnaround” (and breakup) is complete, it will have cost 80,000 jobs.
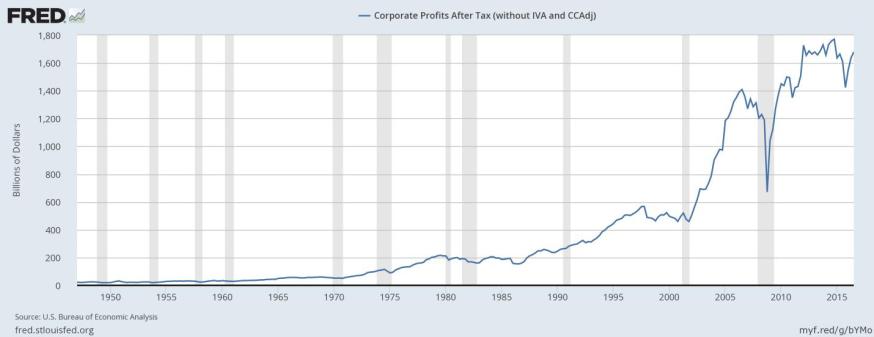
Figure 1, from the Federal Reserve Bank of St. Louis, shows the history of U.S. corporate profits (in USD billions) since 1949.
Figure 1: Federal Reserve Data Base: After-tax corporate profits

Prior to 1990, the two curves are roughly in parallel, with a few short periods where investment actually exceeded profits, notably during the “dot.com” boom. But since 2008, investments have been far below profits. The difference was mostly used by CEOs to buy shares of their own companies. (In most cases, they would have done better to buy shares of their rivals.)
Figure 2: Federal Reserve Data Base: Net domestic investment

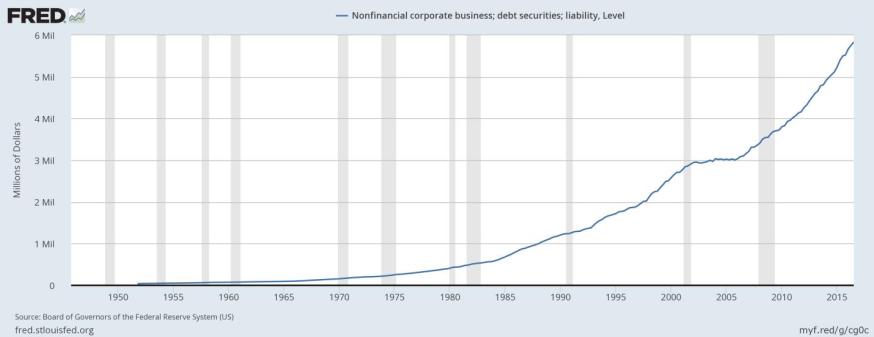
Many companies are now even spending more than they earn to pay dividends and buy back shares. The only way they can do that is by borrowing. The borrowing (for all purposes) of U.S. non-financial corporations was negligible before 1980 but it has been rising steadily since then; see Figure 3. Much of the corporate debt incurred in the 1980s and ‘90s was in the form of ‘junk bonds’ created to finance corporate buyouts and acquisitions. Since 2000, a large amount of corporate debt has financed share buybacks.
Figure 3: Federal Reserve Data Base: Level of debt security liability for nonfinancial corporate business

Pay for share price performance
Another way SVM has been achieved is share price-based compensation, marrying the success of the CEOs to the success of the share price. However, CEOs in public companies tend to last 10 years in the job, less if they don’t perform. When compensation is tied to share price, they are rationally driven to take advantage of any legal mechanism to drive share prices up during their tenure. The mechanism that they have used, since it was first legalised by the U.S. Securities and Exchange Commission (SEC), in 1982, is the ‘share buy-back’. (Under rule 10b-18 of the Securities and Exchange Act of 1934, it was illegal to “manipulate” share prices. However President Ronald Reagan’s appointee to head the SEC, a former CEO of the NYSE, changed the rule, creating a “safe harbour” for companies to do it.)
Republican lawmakers have been keen to blame the secular slowdown in U.S. economic growth on excessive regulation, such as the Volcker Rule that prevents banks from proprietary trading.
However, the evidence suggests that the slow economic recovery since 2009 was caused mainly by the diversion of corporate profits from investment into corporate share repurchasing. This activity has resulted in an increase in the wealth of shareholders, but a decrease in the “normal” rate of economic growth. It is what standard growth theory would predict as a consequence of reduced investment in capital stock.
Another consequence of this trend has been the great increase in relative compensation between CEOs and their employees. Before 1980, over 90 percent of total CEO compensation was salary and “performance” bonuses. In the last decade, two thirds of CEO pay has come from share-price related schemes. And the ratio of CEO pay to median employee pay in public companies has risen from around 30:1 in the 1970s to over 300:1 currently.
This has contributed significantly to income inequality, especially when it turns out that, from the Great Crash in 1929 until 1979, the income share of the top 10 percent and the top 1 percent actually declined, due to progressive taxation. The economy became less unequal. But since 1980, the situation has reversed: almost all gains in the economy since then have gone to the top 10 percent and well over half to the top 1 percent. This has a second adverse impact on economic growth: the bottom 90 percent of income is spent mostly on goods and services, contributing directly to the GDP. However, the people in the highest income groups do not spend much of their incomes for goods and services (apart from yachts and corporate jets). They “save” most of it, contributing to asset bubbles. If the income distribution were more nearly equal, the economy would grow faster. In short, inequality is a second “headwind” to growth (the first being lack of reinvestment of profits), all other factors remaining the same.


No comments yet.